Video Marketing Statistics 2020
The State of Video Marketing
We gathered the stats below by surveying 656 unique respondents in December 2019. Our sample included both marketing professionals and online consumers. We separated these groups with a preliminary question, ensuring that respondents were only asked to answer the questions relevant to them. Our trends data is based on 6 years of asking these questions.
Citation Policy:
Please feel free to use these statistics in any commercial or non-commercial capacity. If you use the statistics we require a link to Wyzowl
01
Video marketing overview
How many businesses use video as a marketing tool – and how do they use it?
View trend chart
View trend chart

02
2019 in review
How did the video marketing landscape change in 2019?

03
The ROI of video marketing
How do marketers feel about the return they get on their investment in video?

04
Non-video marketers
Why are some marketers still reluctant to invest in video?
05
The Audience View: Consumers and video
Putting aside what marketers think about video – how do their audiences feel about it?
When asked how they’d most like to learn about a product or service, two-thirds of people (66%) said they’d prefer to watch a short video. This compares to 18% who’d rather read a text-based article, website or post, 4% who’d like to view an infographic, 3% who’d rather download an ebook or manual, 3% who’d rather attend a webinar or pitch, and 2% who’d like a sales call or demo.
06
Video marketing on social media
How do marketers plan to use video in 2020?
07
Video platforms
Which platforms do video marketers use – and which ones do they find most effective?
08
Year over year trends
We’ve conducted an annual survey every year since 2015. What does comparing our data, year over year, reveal about the general trajectory of video marketing?
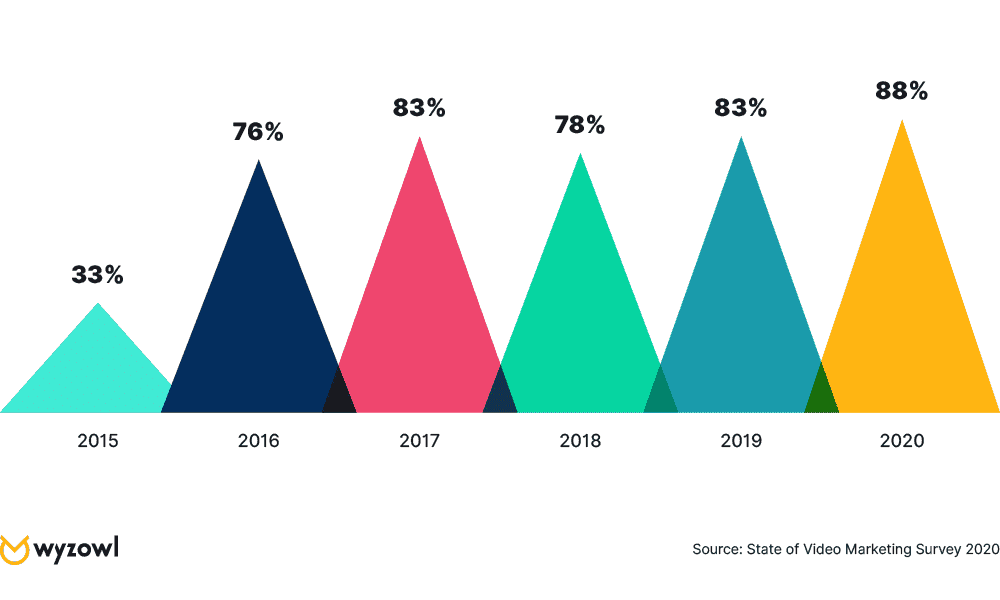
Does your business use video as a marketing tool?
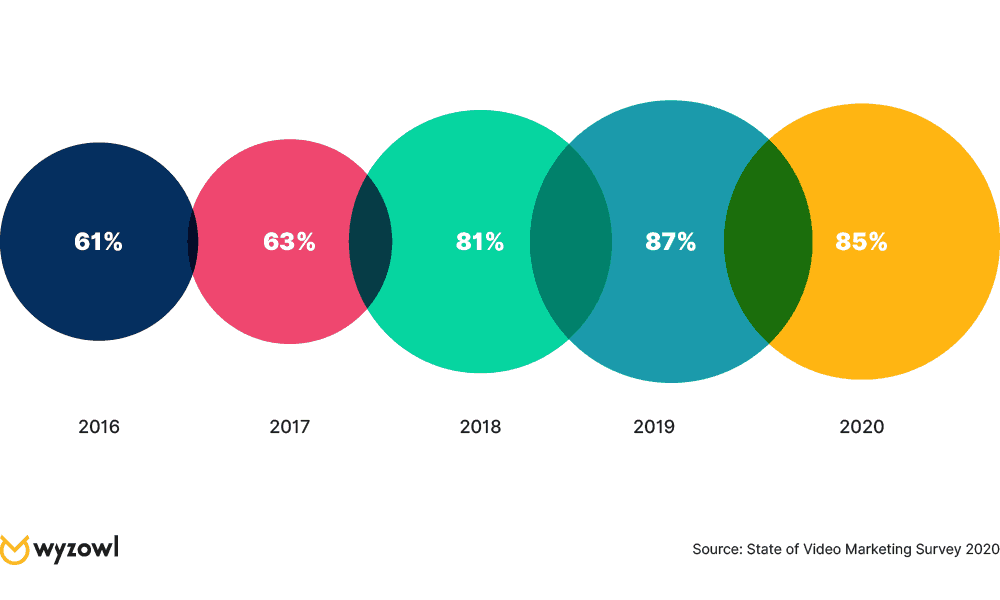
Is video an important part of your marketing strategy?
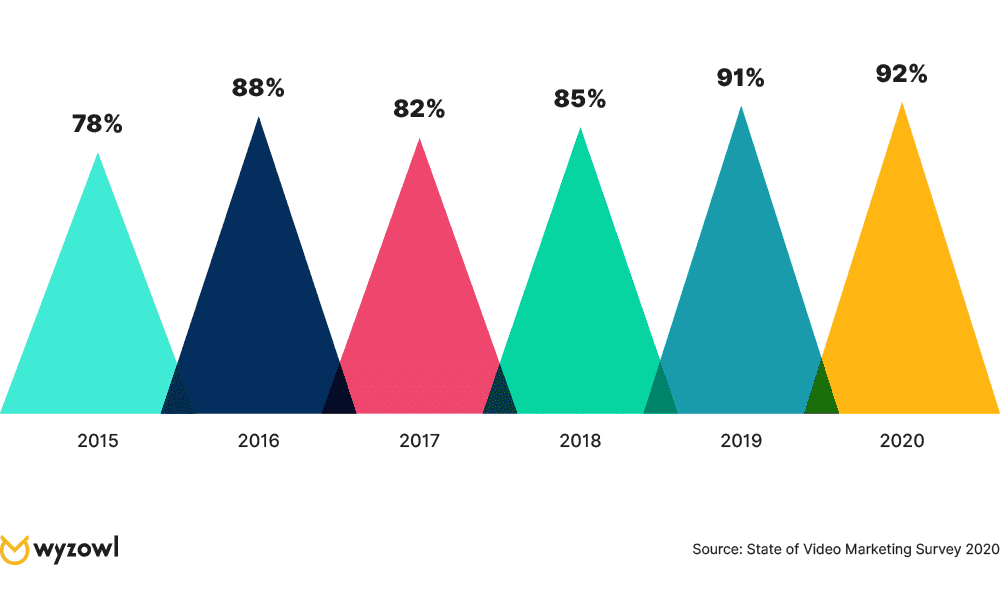
Has your video marketing led to a greater understanding of your product or service?
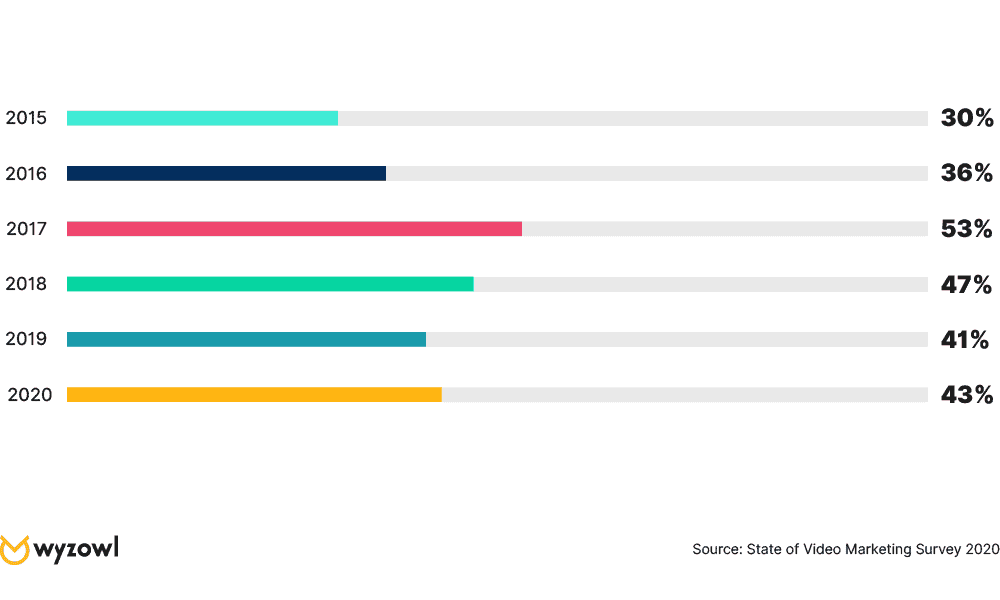
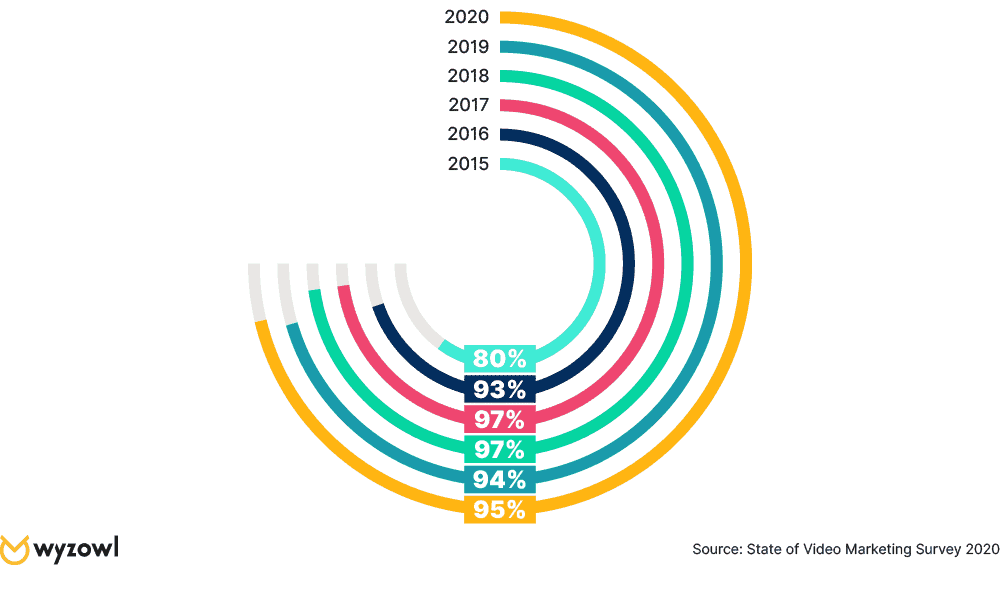
Has your video marketing reduced the number of support calls you’ve received?
